Why System Monitoring Keeps BSD Running Smoothly
Every BSD system runs better when its resources are well understood. Whether managing a server or a personal machine, using the best tools for monitoring system performance on BSD reveals what’s happening behind the scenes. It helps track CPU usage, memory load, disk performance, and more.
Without proper monitoring, problems can sneak up and cause slowdowns or outages. High CPU load, full storage, or a misbehaving process may not be obvious at first. Monitoring tools provide early warnings and clear data for troubleshooting.
A good set of tools lets users respond faster and keep things stable. BSD systems have several reliable options that fit different needs, from real-time dashboards to detailed logs.
Using top for Real-Time Process and Resource Viewing
One of the best tools for monitoring system performance on BSD is top, a real-time utility that gives a live view of system resources, showing which processes use the most CPU, memory, or I/O. It updates every few seconds and sorts tasks by usage, making it easy to spot outliers.
For example, if a process begins to hog memory or use all available CPU cores, top shows it right away. It also gives a quick summary of total system activity at the top of the screen, including uptime and load averages.
Users rely on top during high traffic or after launching new services. Its simplicity and built-in availability make it a go-to tool for spotting trends and reacting in real time.
Checking Disk Usage and Health with iostat
When a system slows down, the problem is often with the disk. That’s where iostat helps. It tracks read and write speeds, device load, and wait times, which reveal whether the disks are handling data smoothly or getting overwhelmed.
On FreeBSD, the iostat command is part of the sysutils/sysstat package. It’s lightweight and easy to use, giving a snapshot or continuous update of performance. It’s especially helpful during file transfers, backups, or database activity.
Admins running storage-heavy tasks use iostat to balance disk usage across drives. Seeing high wait times or poor throughput can signal the need for cleanup, hardware changes, or job rescheduling.
Watching System Logs with tail and less
Logs tell the story of what’s happening under the hood. BSD systems write logs to /var/log, where files like messages, auth.log, and dmesg live. Using tail -f to follow these files in real time reveals events as they happen.
For instance, if a service crashes or a login fails, the logs capture that immediately. Tools like less let users search through older entries to find patterns or repeated problems. This is helpful for spotting recurring network errors or hardware issues.
Even for users without deep experience, reading logs builds a habit of awareness. Over time, recognizing normal versus unusual entries becomes second nature and helps with early problem detection.
Tracking Network Traffic with netstat and iftop
Network problems can be tough to catch without the right tools. BSD offers netstat to show open connections and listening ports. It also tracks interface statistics like incoming and outgoing traffic, dropped packets, and errors.
For more detailed, real-time traffic monitoring, iftop is a popular option. It displays which connections are using the most bandwidth, sorted by host and port. This makes it easy to see if a backup is using too much upload or if a rogue process is making unexpected calls.
Combined, these tools make it easier to keep a system responsive and secure. Watching traffic patterns over time can also help with planning and tuning firewall or proxy settings.
Using vmstat to View Memory and CPU Usage Trends
Memory problems aren’t always caused by a single program. Sometimes, it’s the result of many smaller things adding up. vmstat shows how memory is being used, along with CPU load, disk I/O, and process scheduling.
Its output includes figures on swap use, free memory, and system interrupts. These stats reveal whether the system is under pressure, paging memory, or idling with resources to spare.
Developers and system admins often use vmstat to track trends. Even short samples taken throughout the day can highlight patterns—like a slow memory leak or regular CPU spikes—that aren’t obvious at a glance.
Logging Everything with systat for a Broader View
systat is a full-screen tool built into BSD that offers different views for monitoring. It can show CPU stats, memory load, disk usage, and more. Each mode presents real-time data in an organized format, making it easy to digest.
Unlike top, which focuses on processes, systat highlights broader metrics like network queues, virtual memory activity, or device throughput. Switching between screens is done with simple key presses, and the tool runs well even on minimal hardware.
This makes it perfect for both day-to-day checks and deeper inspections. It’s especially handy when tuning a server for better performance under heavy load.
Keeping Tabs with Periodic Scripts and Daily Reports
BSD systems include a feature called periodic scripts. These scripts run daily, weekly, or monthly and send reports about system health. They check logs, disk usage, failed logins, and other events. The results are emailed to the root user.
These reports serve as a low-maintenance monitoring method. Even without logging in daily, admins can catch problems like full disks or odd login attempts just by reading the emails.
Many users configure aliases to forward these messages to their regular inbox. This quiet setup works well for small teams or solo admins managing remote machines.
Installing Third-Party Tools for Graphs and Alerts
While built-in tools are great, BSD also supports advanced third-party software for monitoring. Packages like Zabbix, Nagios, or Prometheus can be installed for graphing metrics, sending alerts, and keeping historical data.
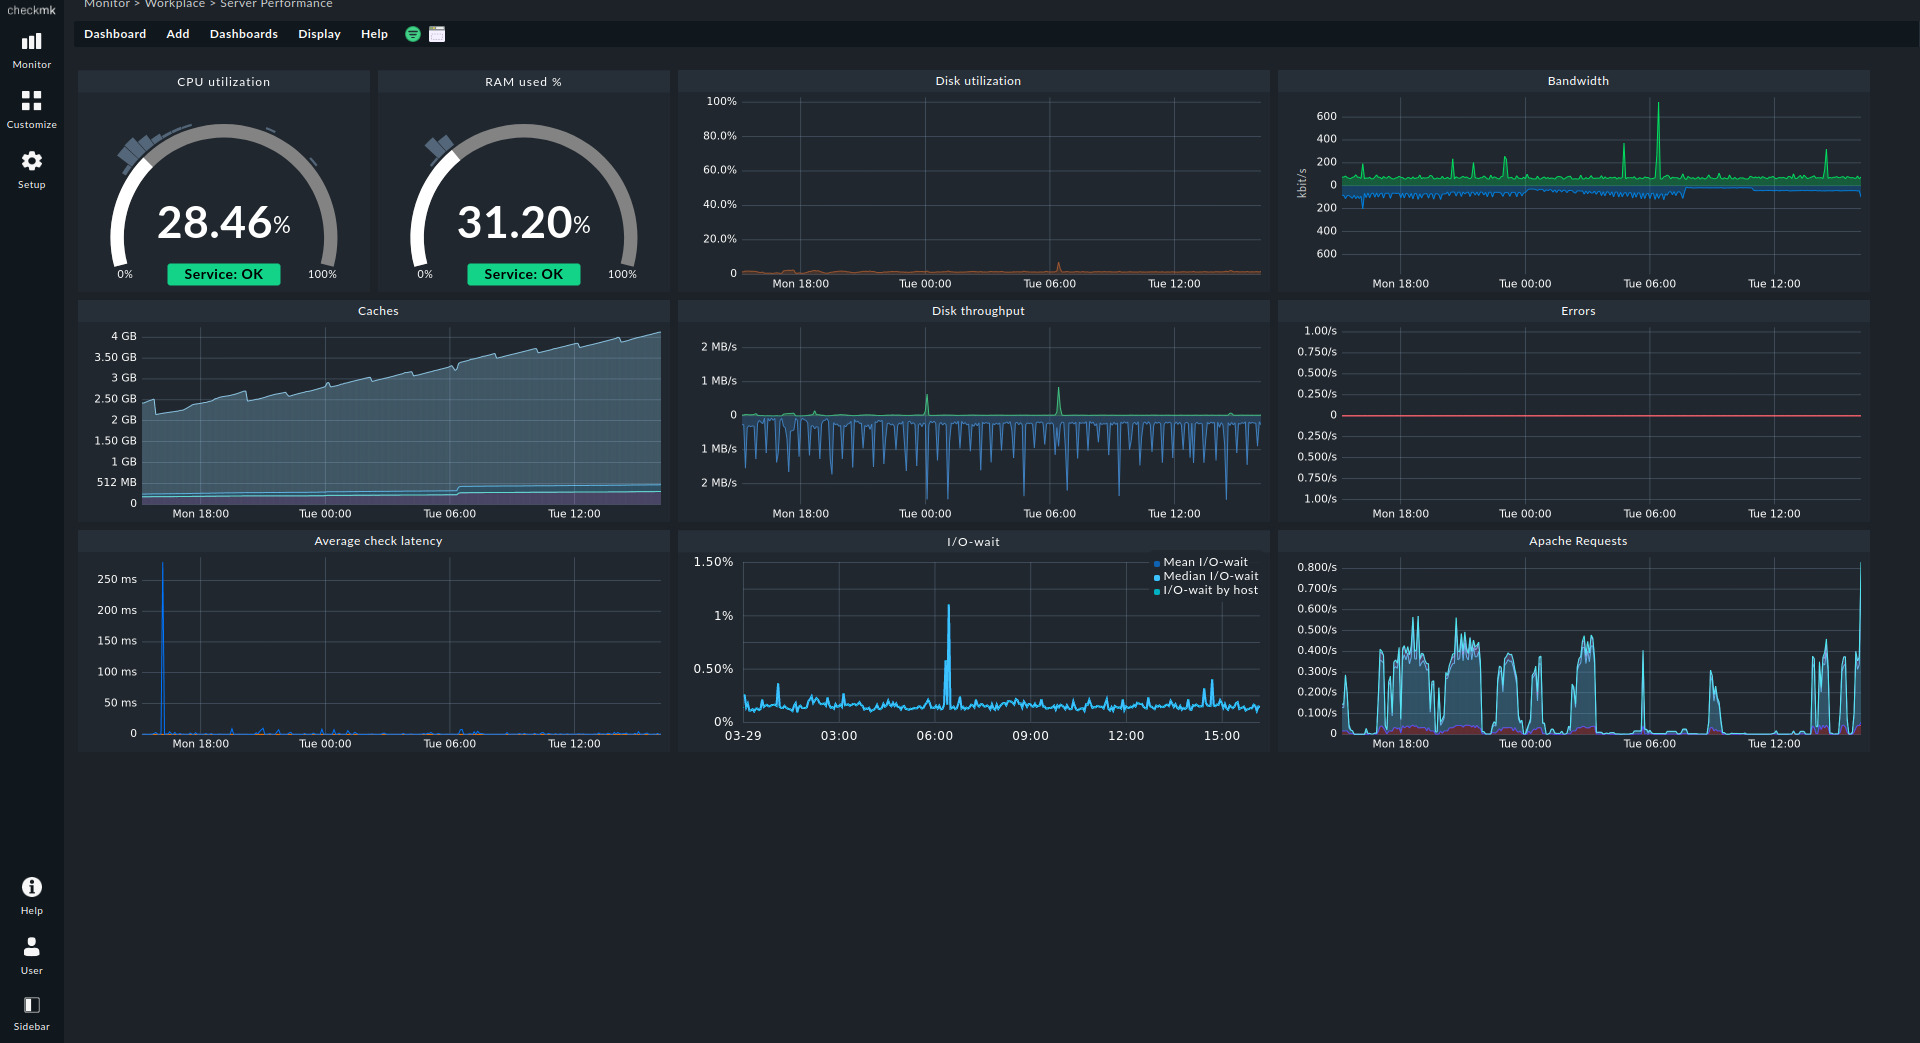
These tools are useful in bigger setups, where seeing trends over time matters. They show CPU spikes, memory leaks, and disk changes using clear visual dashboards. Alerts can also be sent by email or text when a threshold is reached.
Setting up these tools takes more time, but they provide strong long-term insights. Teams managing production servers or customer-facing systems often rely on these to keep everything running smoothly.
Staying Ahead with Routine Checks and Consistent Habits
Monitoring is more than just installing tools. It’s about building habits. Logging in daily to glance at top or scanning a log file helps catch issues early. Regular checks mean fewer surprises and more time to fix things before users are affected.
Simple steps like watching for full disks, checking CPU averages, or reading alerts make a big difference. Over time, these habits lead to a stronger, more stable system that performs well under load and handles new tasks with ease.
With a small investment of time, BSD users can build reliable routines that support both growth and peace of mind—especially when paired with the best tools for monitoring system performance on BSD, which help turn daily checks into powerful habits for long-term stability.


No Responses